Rotary SCANNING using your Fourth Axis
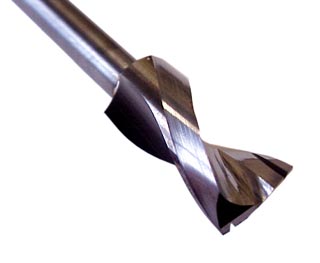
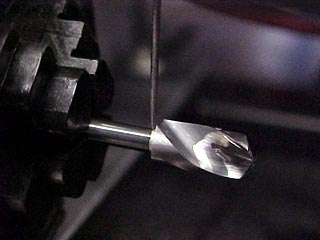
For this tutorial, we scan a simple drill bit
Your Fourth Axis is capable of high-resolution rotary scanning, which is usually best utilized when the XZ scan plane lies above the centre-of-rotation of your Fourth Axis. This article will explain how to determine this point, and how to use the Dr Picza software freely included with your MDX machine to capture rotary data.
As an example target for this procedure, we have selected a carbide drill bit to scan. Whilst this target has some rotational symmetry, it is not imperative to have it spin perfectly concentrically in the chuck. If the drill is eccentric when the scan probe senses it, any offset can easily be corrected when the data is shown in its correct polar representation, by redefining the origin.
Calibrating the Y-motion-table position and rotary axis position.
Why do we worry about these two factors?
- We want the Y-motion-table positioned correctly before a scan, because the most useful data is obtained when the rotation axis is directly under the XZ scan plane.
- Having the rotary axis start at a zero-degree position lets us know absolutely where features are relative to the real-life object. For instance, if you wanted to re-scan a certain area of the object that was still mounted, you know that so long as the Rotary Command reads 'zero' when you initiate the scan, the data will appear in the correct place on your model.
Y-motion-table calibration procedure (in SCAN mode):
If you need a quantitative, numerically repeatable (e.g. for future scans) Y-setback position, the following steps show you how to do this properly through software.
- Start by ensuring your interface is set to the Y-AXIS, then turning on your MDX in "scan" mode with a R.A.P.S. sensor attached.
- At this point, you can mount your scan target in your Fourth Axis after the MDX finishes homing in XYZ. We just used the four-jaw chuck.
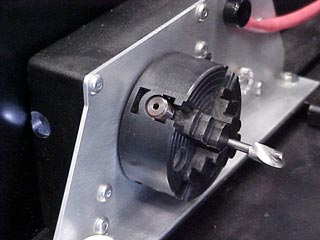
The scan target is mounted in the four-jaw chuck - Now we can run Dr Picza to manipulate the Y-motion-table. Click "Scanning Area" to bring up the familiar blue/yellow dialogue.
- Now enable the "Z Upper Limit" function. Please note, We are NOT trying to find the Z-upper limit, but simply using this as a tool to control the machine until we can find the ideal position of the Y-motion-table for our scan.
-
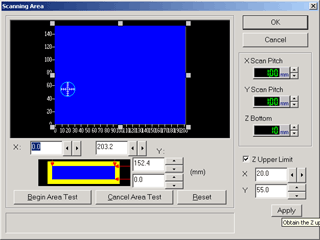
We use the "Scan Settings" dialogue to move the machine for now.In the case of the Fourth Axis®20, we designed it with an ideal Y-setback value of 97.15mm, but each MDX-20 machine is different! You will need to "tickle" a few different spots to find top-dead centre. Please see our Y-setback philosophy article.
Because the complete Y-distance available to an MDX-20 is 152.4mm, we subtract 97.15mm to give us a close estimation of where to send the Y-axis (about Y=55.3mm from the origin). Now "apply" a Z-upper limit of X=20, Y=55.3. In this case, X=20 was used because the drill's shaft allows us to see neatly from the top of the machine how close we are to its middle.
You will need to try values closer or further away from Y=55 to experimentally determine the best Y-setback value for YOUR machine!
- When you you have found the best position of the Y-motion-table for your machine, WAIT UNTIL ALL MOTION HAS STOPPED, and then toggle your interface box to ROTARY mode.
The probe is ideally exactly above the axis of rotation - Now do a Z Upper Limit test at X=0, Y=0 to reset the step buffers in your machine. This is important!
Rotary axis position calibration procedure (in SCAN mode):
If you need a calibrated rotation-start position for your Fourth Axis (perhaps you plan on rescanning part of an object, or need to know which way up it will appear in software), you can follow these steps.
Choosing your scan area:
If you wish to scan exactly one revolution, or a fraction thereof, it's helpful to know how many millimeters in the Y-axis will correspond to one revolution on your rotary axis.
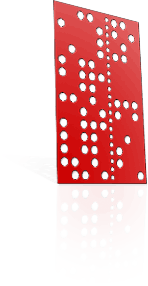
"That's doesn't look like what I scanned!"
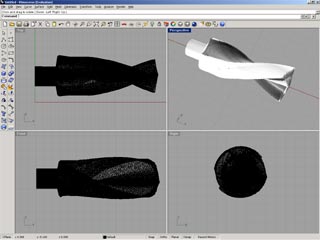
This is the polar representation of the scanned data.
Actually, the data you see is a complete and accurate record of the surface of your target. To represent your data accurately involves a bit of discussion and a few more steps. Please now move on to our Picza-to-Rhino conversion tutorial and our Rotary data in Rhino (representing your model) tutorial, to get your data looking like this!